S.M.A.R.T., KPIs, and Balanced Scorecards
The concept of S.M.A.R.T. goals and objectives has been evident in business practices since 1981. These ideas first came to light in the article “There’s a S.M.A.R.T. Way to Write Management Goals and Objectives” 1 by George Doran, Arthur Miller, and James Cunningham. The “S.M.A.R.T.” acronym stands for Specific, Measurable, Attainable, Relevant, and Time-Based.
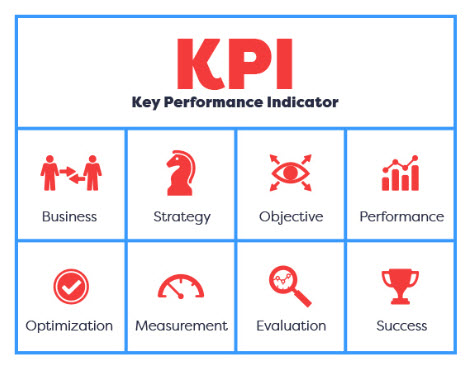
Peter Drucker once said, “If you can’t measure it, you can’t manage it.” Peter Drucker is described as the father of modern-day Key Process Indicators, “Not until the late 1990s did his concepts associated with key performance indicators (KPI) and the introduction of Robert S. Kaplan and David P. Norton’s Balanced Scorecard allow for KPI Dashboards to become popular. Today, using dashboards has become an important part of business success and management decisions.” 2
These concepts are an inherent part of how medium to large corporations manage their businesses after setting well-defined strategies. They can also be quite valuable for small companies. KPIs can make companies of any size successful if their design supports the S.M.A.R.T. strategy and if employees understand it. Let’s examine a small business case study around S.M.A.R.T. goals.
Industry:
The client is a modestly profitable distributor & service rep for manufacturers of currency, coins, check counting, and check scanning equipment. Their historical territory was in the Midwest, and they served financial establishments and casinos in this area. The business has successfully served this territory and niche product line since its founding in the 1980s, but they want to position themselves to grow into other regions and markets and add new product lines like electronic signage.
They traditionally sold and serviced premium equipment but recently added economy equipment offerings as a defensive move to sell to customers who did not want or could not afford the premium brands. The client has also successfully added internet sales as an additional sales channel and offers small desktop machines through their e-commerce platform.
The client is profitable with a high market share within their industries. They are, however, not in a position to grow by entering new territories or markets or adding product lines. They do have an extremely high performance in post-sales support. This support is the momentum that keeps them ahead of the competition. Although equipment sales generate profit, the service aspect of the business generates a much higher gross margin.
Challenges:
Aside from some primary goals for each salesperson, this company has never set or required goals for approximately 80% of the staff. About half of the staff are field service people with day-to-day contact with customers. The client did have a good ERP and time tracking system that captured the granular details with poor management reporting, but the field service people managed their own time as they saw fit. The reports from the system were only generating a low level of detail.
The field service people did receive customer work orders from the home office, which would go into each person’s backlog, but the workers scheduled their travel departure, arrival, and end-of-day departure. Many employees appeared not to be working an entire workday, with rumors of non-work-related activities during working hours.
Other staff members in the office went about their daily duties but had yet to have any goals assigned for them to achieve during the year. Most employees did like working for the company and looked forward to quarterly (sales) or annual bonuses, and company leadership determined the latter based on subjective perceptions. A group trip as part of the President’s Club went to the year’s highest achievers.
The challenge was to develop a management process that rewarded people based on S.M.A.R.T. KPIs that would positively impact the company’s performance while still maintaining the company’s exceptional customer service. Accomplishing this required a balanced scorecard, not merely based on financial performance.
Solutions:
The client established a companywide Opportunity Wall to identify financially driven and soft improvements to improve organizational efficiency. Also, job descriptions and quarterly employee performance expectations were drafted and implemented with S.M.A.R.T. KPIs.
The KPIs covered a broad range of measuring activities at all levels of the organization:
| Scorecard Type | KPI | Measurement | Leadership Team Member(s) | Sales Reps | Filed Service People | Other Support Staff |
| F | Sales vs. Goal | $ | X | X | ||
| F | New Service Agreements | % | X | |||
| F | Measure of CRM Calendar Usage | Low/Medium/High | X | |||
| F | New Machines <= $3,000 Unit Price | % | X | |||
| F | Gross Margin | $ | X | X | ||
| F | SG&A | $ | X | |||
| F | Net Profit | $ | X | |||
| B | Customer Satisfaction | >XX% | X | X | X | X |
| F | Customer Acquisition Cost / Rev. | <X% | X | |||
| F | Fin. & Ops. Reporting | OTIF >XX% | X | |||
| F | Accounts Receivable | DSO # | X | |||
| F | Accounts Payable | DPO # | X | |||
| F | Cash Management | CCC # | X | |||
| F | Inventory Turnover | #/Year | X | X | ||
| F | Inventory Count Accuracy | >XX% | X | X | ||
| F | Inventory Writeoffs | <X% | X | X | ||
| B | Payroll | OTIF >XX% | X | |||
| B | Regulatory Compliance | % | X | |||
| B | Create On Boarding Process | Yes/No | X | |||
| B | Opportunity Wall | Monthly Review | X | |||
| B | Teamwork / Employee Peer Reviews | >XX% | X | X | ||
| B | Normal Workday Utilization | >XX% | X | |||
| B | Normal Workday On Time Arrival | >XX% | X | |||
| B | Normal Workday Early Departure | <X% | X | |||
| B | Warehouse Housekeeping | Checklist | X | |||
| B | Training / Cross Training & SOPs: | Yes/No | X | X | X | X |
| B | Other Projects | Yes/No | X | |||
| F | Financial | 15 | ||||
| B | Efficiency / Compliance | 12 | ||||
| Total | KPIs for the Balanced Scorecard | 27 | ||||
| Note: Safety, Environmental and Community Relations could also be KPIs and could be non-financial based | ||||||
Results:
The implementation process included Rollout Meetings first companywide, then by functional group, and then with each individual. As part of the individual meetings, the Job Descriptions, developed with employee input, were signed by company leadership and each employee.
Quarterly Employee Performance documents were prepared and reviewed during the individual meetings, which explicitly explained the grading process based on the individual’s Balance Scorecard KPIs and will be used to determine quarterly bonuses and annual wage increases. Discussions commenced with each employee that had predetermined performance improvements.
Most employees received the process well. Most wanted clear direction and assigning clear roles, responsibilities, and accountabilities from the Leadership Team. A few may not want to work under this process, but overall, the improvement of the organization’s performance is the end goal.
1 Doran, G. T. (1981). “There’s a S.M.A.R.T. Way to Write Management’s Goals and Objectives”, Management Review, Vol. 70, Issue 11, pp. 35-36.
2 no author, ‘Peter Drucker, Father of KPI and the dashboards that track them. A major inspiration for the KPI Framework that we have today.’, BlueCallom Corp., Kreuzstrasse 26/Floor 4th, 8008 Zürich, Switzerland https://bluecallom.com/peter-drucker/ Accessed: 06/08/2023


