Whether your business is a startup, a growing organization, or a business going through changes, developing accurate and relevant reporting practices can feel overwhelming. Doing so, however, is crucial to delivering a quality product with a profitable margin. By utilizing sound reporting methodologies, your business can plan strategically for material budgeting, productivity, product quality and cost, and safety. Further, implementing best practices in reporting helps with understanding and correcting problems with products returned by customers.
So how should your business go about establishing best practices in reporting? Zach Hale answers this question in a Software Advice article titled “5 Effective ERP Reporting Strategies for Your Business.”
- Make sure your data is clean and accurate.
- Track only what you need to track.
- Allocate resources for data collection, analysis, and support.
- Prioritize reporting development in future growth plans.
- Choose an ERP with the right reporting capabilities.
As a business leader, it is imperative to be forward-thinking. One of the key ways to do this is to train your employees specifically in what and how you would like reported. Without clear expectations in place, employees may not view reporting as part of their job and often report inaccurately based solely on memory or do not report at all. Automated reporting is not necessarily the answer. Machine operators, welders, and others in your business can still be responsible for manually recording each day. They are the experts in their field and are best equipped to identify capacities and barriers. Your organization must provide training and clear expectations to any employee expected to report data, and should allocate resources with this in mind. As with any expectations of employees, reinforcement through positive recognition goes a long way.
How do you establish what accurate reporting looks like for your unique business? The first step is to identify the capacity of your operation. For example, how many widgets per hour or minute can be produced at a perfect run rate? In order to determine this, perform a time study. Remove any lost time from your study (e.g., the machine operator had to go retrieve raw material or make machine adjustments), as these things can be addressed and remedied. Once your operators agree on the number of widgets per hour or minute, your business has established a “capacity.” This is a critical part of planning and reporting and should be your business’ daily or hourly goal. This process for capacity should be completed for every product your business manufactures. See below for an example:

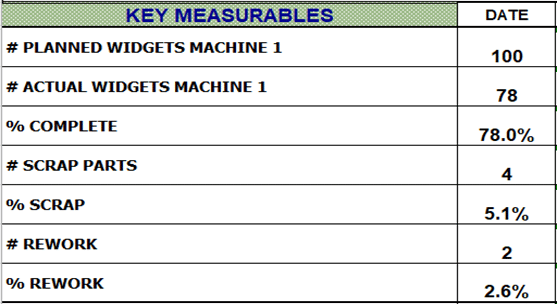
Next, decide what components of your manufacturing process are most relevant to your goals (e.g., product quality and profit margin), and make recording those components a priority. Each facet of your manufacturing line that affects these goals should be captured individually. Overanalyzing too much irrelevant information can lead to “analysis paralysis,” which can cause challenges when it comes to making goal-based business decisions. See below for an example of an easy-to-read, succinct yet detailed metric of how the operation performed to capacity, which allows for insight into any problem areas.

One of the major mistakes in reporting is to look at only one snapshot in time, when trends can play an important role. Once your organization has reported accurately for weeks or months, establish a historical performance for each item you are tracking, then set a reasonable goal to improve your numbers.

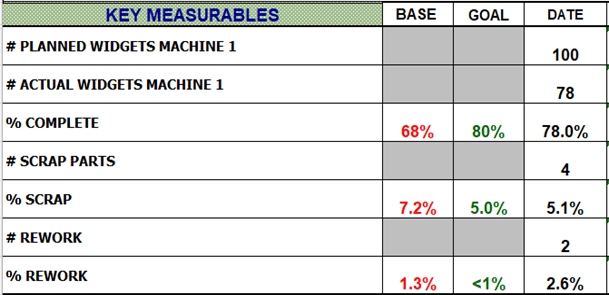
The chart above shows both base and goal numbers in their own columns, along with the date’s performance. Notice that some numbers are grayed out. This is because an individual area of planned-to-actual may be consistent enough on a daily basis to have a hard base number. If there are variables in the quantity of widgets run or the quantity of scrap and rework, however, the recorded percentages provide an accurate comparison of performance. With this information your organization can see trends and make decisions based on actual data.
In the example above, the run performance and scrap rate are an improvement over how the organization has historically performed, but the rework rate is higher. Initial response from management may be to identify why the rework rate increased and what actions need to be taken to prevent a recurrence. Depending upon the product, decisions could also be made in regards to completing less than planned or falling short of the goal. An inventory order may be treated differently than a just-in-time order to meet customer commitments. Though while the planned quantity should be based upon the observations (capacity), the committed quantity should be +/- 80% of that quantity, as world class is measured at 85%.
The longer your organization can consistently track data cleanly and accurately, the better you can analyze trends against time periods. See the example below for a fuller picture of performance:

Here we can see that the productivity has improved from historical performance and is averaging close to the goal. It is important to keep in mind that the “Date” may be in days, weeks, or both, depending upon your organization’s product and lead time. In this example, we’ll assume that the organization had previously identified the reason why it was averaging only 68% completion and implemented a plan to improve, which is working based on the evidence. The scrap rate continues to be above both the base and the goal, and the organization should have actions or data collection in place to understand the root cause of this in order to effectively address the problem. The rework shows a couple of high periods, but overall is close to the goal, which would warrant positive reinforcement for the operator.
This same reporting format can also be used to report all areas and equipment, along with planned-to-actual deliveries and safety, allowing for a simple one to two page report on a daily or weekly basis that covers the organization’s entire operational structure. As applicable, additional line items and measurables may include planned-to-actual labor hours and costs along with a labor-cost-per-unit factor, machine-cost-per-hour, machine uptime hours, or whatever it is that your unique business needs to track in order to deliver a quality product with a profitable margin. The importance, though, is to understand the trends on each of the key measurables to systematically address issues so that attainable goals can be set and your business can continue to improve.
To learn more about how you can implement best reporting practices in your business, reach out to our team at Cogent Analytics. We will begin our Discovery Process, which is tailored to the unique needs of your business, to create a roadmap to a more successful, sustainable future for your organization.


