Nearly all companies in business today prepare some forward-looking type estimate of what they believe their sales and gross revenue will be over the next revenue cycle at a minimum and most go out until the end of the fiscal year. The revenue cycle is the time between when raw materials are ordered to begin the conversion process until when the sale of the product to a customer is completed. This is typically called the “Revenue Forecast,” and it is the primary input for almost every financial decision that a company will make, from investing in new equipment to increase capacity or to initiate a price increase and/or price reduction based on current market conditions. In most large companies today, some salespeople have the responsibility for preparing the initial revenue estimate for their sales territory and/or key account relationships. These estimates would go to the sales manager who would roll-up and review the revenue forecasts, and then make any adjustments to the forecast. In very large companies, this may take place at multiple levels of the sales organization. Typically, the final revenue forecast is reviewed by the Senior Vice President of Sales and a Sales Finance leader before presenting the revenue forecast to the leadership team. In smaller organizations, there may only be two or three individuals who work on the revenue forecast and then present it to the owner or president of the company.
Based on the size and complexity of the organization, there may be just only one product family with a few variations or there may be hundreds or even thousands of SKU’s (stock keeping units) that a company may need to forecast in order to understand the sales variances that have occurred and to make the appropriate adjustments. In addition to preparing a Gross Revenue forecast (gross price per unit x number of units), most companies provide Sales Incentives (price reductions, growth rebates, coupons, free samples, co-op incentives, etc.) to their customers and these investments must also be forecasted to obtain the Net Revenue forecast. During the monthly close process, most companies will present the current month financial results and then present a monthly Gross Revenue and Net Revenue forecast extending through the end of the current fiscal year. The following forecast example will use a Gross Revenue forecast and a Sales Incentive forecast to come up with a Net Revenue Forecast. This is a very simple Net Revenue Forecast that you would typically see at a small company with one or two finance people managing the day to day business operations. The individual(s) performing this forecast would likely spend a less than a day at the end of the quarter performing the forecast activity and would more than likely be very conservative in their assumptions.
Without a detailed Gross Revenue and Sales Incentive forecast for every customer and product, the most used revenue forecast process is to calculate the current year to date actual sales and divide it by the actual sales of the same time period of a previous year (or the budget sales of the same time period). This is the Revenue Growth Index for that time period. The Revenue Growth Index is then multiplied by the previous year sales for the same time period (or the budget sales of the same period) to calculate the Revenue Forecast. When forecasting the Sales Incentives for the balance of the year, the best way to do this is to calculate the Sales Incentives as a percent of Gross Revenue and compare the Forecast % of Gross Revenue to the Actual % of Gross Revenue.
The time periods for this example are the four quarters of the year and are described below:
- Actual: Quarter 1 and Quarter 2 of the current year
- Forecast: Quarter 3 and Quarter 4 of the current year
- Budget: Quarter 1, Quarter 2, Quarter 3 and Quarter 4 of the current budget year
- Actual 1 YAG: Quarter 1, Quarter 2, Quarter 3 and Quarter 4 of the prior year
- Actual 2 YAG: Quarter 1, Quarter 2, Quarter 3 and Quarter 4 of two years ago
The formulas in the Net Revenue section are the same as the ones used in the Gross Revenue section.
GROSS REVENUE: The Actual/Forecast vs. Budget, vs. 1YAG, vs. 2YAG boxes, the formulas are as follows:
Current Actual vs. Budget Qtr 1: 1,125/1,100 = 102.3% growth
Current Actual vs. Budget Qtr 2: 1,350/1,300 = 103.8% growth
Forecast vs. Budget Qtr 3: 1,450/1,500 = 96.7% growth
Forecast vs. Budget Qtr 4: 1,150/1,200 = 95.8% growth
Total Actual/Forecast vs. Budget: 5,075/5,100 = 99.5% growth
Current Actual vs. 1 YAG Qtr 1: 1,125/1,050 = 107.1% growth
Current Actual vs. 1 YAG Qtr 2: 1,350/1,250 = 108.0% growth
Forecast vs. 1 YAG Qtr 3: 1,450/1,450 = 100.0% growth
Forecast vs. 1 YAG Qtr 4: 1,150/1,150 = 100.0% growth
Total Actual/Forecast vs. 1 YAG: 5,075/4,900 = 103.6%
Current Actual vs. 2 YAG Qtr 1: 1,125/1,000 = 112.5% growth
Current Actual vs. 2 YAG Qtr 2: 1,350/1,200 = 112.5% growth
Forecast vs. 2 YAG Qtr 3: 1,450/1,400 = 103.6% growth
Forecast vs. 2 YAG Qtr 4: 1,150/1,100 = 104.5% growth
Total Actual/Forecast vs. 2 YAG: 5,075/4,700 = 108.0%
SALES INCENTIVES: The Actual/Forecast vs Budget, vs 1YAG, vs 2YAG boxes, the formulas are as follows:
Current Actual Qtr 1: 120/1,125 = 10.7%
Current Actual Qtr 2: 145/1,350 = 10.7%
Forecast Qtr 3: 140/1,450 = 9.7%
Forecast Qtr 4: 110/1,150 = 9.6%
Total Actual/Forecast: 515/5,075 = 10.1%
Current Actual vs. Budget Qtr 1: 110/1,100 = 10.0%
Current Actual vs. Budget Qtr 2: 130/1,300 = 10.0%
Forecast vs. Budget Qtr 3: 150/1,500 = 10.0%
Forecast vs. Budget Qtr 4: 120/1,200 = 10.0%
Total Actual/Forecast vs. Budget: 510/5,100 = 10.0%
Current Actual vs. 1 YAG Qtr 1: 100/1,050 = 9.5%
Current Actual vs. 1 YAG Qtr 2: 120/1,250 = 9.6%
Forecast vs. 1 YAG Qtr 3: 140/1,450 = 9.7%
Forecast vs. 1 YAG Qtr 4: 113/1,150 = 9.8%
Total Actual/Forecast vs. 1 YAG: 473/4,900 = 9.7%
Current Actual vs. 2 YAG Qtr 1: 90/1,000 = 9.0%
Current Actual vs. 2 YAG Qtr 2: 110/1,200 = 9.2%
Forecast vs. 2 YAG Qtr 3: 130/1,400 = 9.3%
Forecast vs. 2 YAG Qtr 4: 103/1,100 = 9.4%
Total Actual/Forecast vs. 2 YAG: 433/4,700 = 9.2%
The formulas in the Net Revenue section are the same as the ones used in the Gross Revenue section.
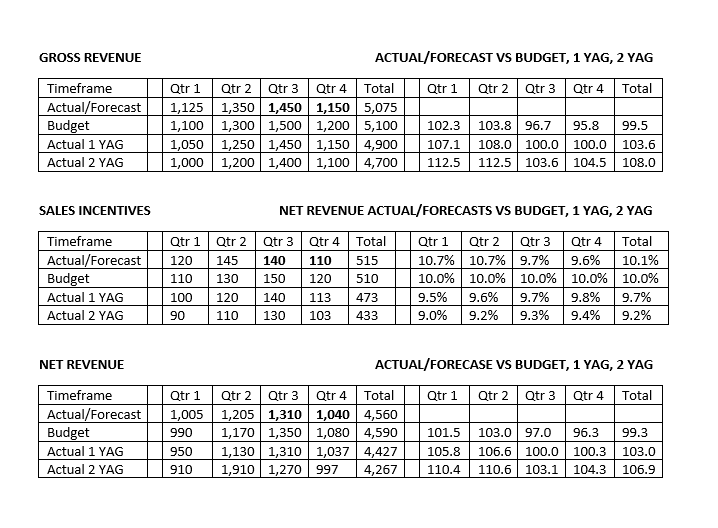
The original GROSS REVENUE, SALES INCENTIVES and NET REVENUE Forecast is shown below:
Analysis of the Forecast
The current forecast seems to be very conservative both from the Gross Revenue perspective and from the Sales Incentives perspective which will make Net Revenue conservative as well. The Actual results for Quarter 1 and Quarter 2 show the Gross Revenue Indexes vs. Budget to be at 102.3% growth and 103.8% growth while the Gross Revenue Forecast Index is only 96.7% growth and 95.8% growth for Quarter 3 and Quarter 4. In addition, the Actual results for Quarter 1 and Quarter 2 show the Gross Sales Indexes vs. 1 YAG to be 107.1% growth and 108.0% growth while the Gross Sales Forecast Index is only 100.0% growth and 100.0% growth for Quarter 3 and Quarter 4. Similarly, the Actual results for Quarter 1 and Quarter 2 show the Gross Revenue Indexes vs. 2 YAG to be 112.5% growth and 112.5% growth while the Gross Sales Forecast Index is only 103.6% and 104.5% for Quarter 3 and Quarter 4.
The Sales Incentives Forecast also seems to be very conservative as the Actual results for Quarter 1 and Quarter 2 versus Budget were 10.7% and 10.7% respectively, while the Sales Incentives Forecast is only 9.7% and 9.6% in Quarter 3 and Quarter 4. The Sales Incentives Budget was 10% in every Quarter of the current year. The Sales Incentive Actual 1 YAG Results were 9.5%, 9.6%, 9.7%, and 9.8% in Quarters 1, 2, 3 and 4 respectively, and, the Actual 2 YAG Results were 9.0%, 9.2%, 9.3%, and 9.4% in Quarters 1, 2, 3 and 4 respectively. So it seems like the Sales Incentives % of Sales Revenue has been slowly climbing over the last two years but had a substantial increase Quarter 1 and Quarter 2 of the current year, and should be forecasted similarly.
The Actual Results for Quarter 1 and Quarter 2 show the Net Revenue Indexes vs. Budget to be at 101.5% growth and 103.0% growth in Quarter 1 and Quarter 2, but the Net Revenue Forecast Index is only 97.0% growth and 96.3% in Quarter 3 and Quarter 4. The Actual Results for Quarter 1 and Quarter 2 show the Net Revenue indexes vs. 1 YAG to be 105.8% growth and 106.6% growth in Quarter 1 and Quarter 2 and 100.0% and 100.3% in Quarter 3 and Quarter 4. Similarly, the Actual results for Quarter 1 and Quarter 2 show the Net Sales Indexes vs. 2 YAG to be 110.4% growth and 110.6% growth while the Gross Sales Forecast Index is only 103.1% growth and 104.3% growth for Quarter 3 and Quarter 4.
Adjustments to the Forecast
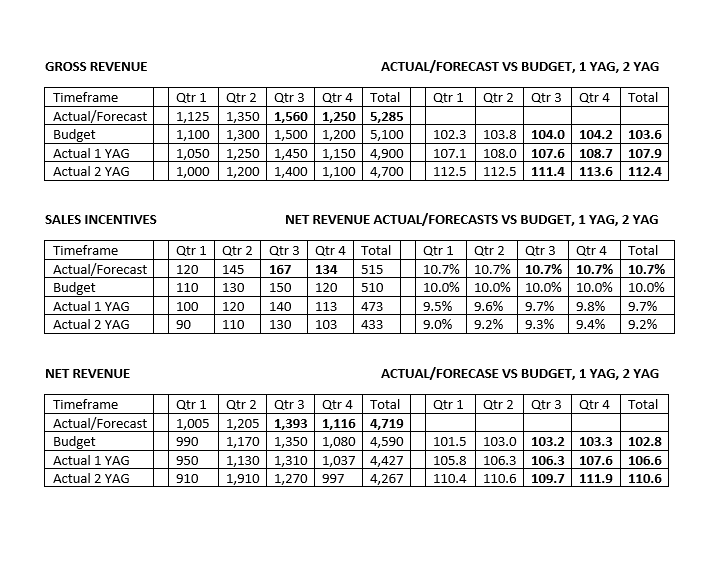
As noted earlier, the initial forecast was very conservative and would have ended up below the original Net Revenue Budget (4,560 in Actual Net Revenue versus 4,590 in Budget Net Revenue). The primary issue was that the Actual Revenue growth in the original model was robust in the first half but was substantially lower in the second half – this shows the Revenue Growth of the 1st half of the year less the revenue growth of the 2nd half of the year: (Gross Revenue vs Budget: (96.3% – 103.1% = -6.8%), Gross Revenue vs Actual 1 YAG: (100.0% -107.6% = -7.6%), Gross Revenue vs Actual 2 YAG: (104.1% – 112.5% = -8.5%). The Net Revenue growth in the original model was also very strong in the first half but was substantially lower in the second half – this shows the Revenue Growth of the 1st half of the year less the revenue growth of the 2nd half of the year: (Net Revenue vs Budget: (96.7% – 102.3% = -5.6%), Net Revenue vs Actual 1 YAG: (100.1% – 106.3% = -6.1%), Net Revenue vs Actual 2 YAG: (103.7% – 110.5% – 6.8%). If the company used the original forecast to make business decisions, then they may not have made investments that would have allowed them to achieve a higher Net Revenue.
At Cogent Analytics, we never stop looking for ways to improve your business and neither should you. So, check out some of our other posts for helpful business information:
